
Introduction | Operating Systems | Data formats | CLIs | Bioinformatics programmes
Introduction
Laboratory scientists often seem to think of bioinformatics as just an add-on to 'wet' laboratory science, but in reality it’s a huge multidisciplinary area, so it’s helpful to understand what it is you want to achieve before you dive into courses or programming languages. There are challenges to combining these areas, as discussed in this paper. Some examples of bioinformatics uses include:
- Statistical analysis (including programmes such as R, SPSS, GraphPad Prism and STATA)
- Geographical imaging software (GIS) (e.g. QGIS)
- Visualising and analysing protein structure (e.g. Chimera)
- Processing genetic data (e.g. Guppy, MiniMap2)
- Visualising genomic data (e.g. Artemis, SnapGene, FigTree)
- Creating images (e.g. BioRender)
These programmes utilise either a graphical user interface (GUI), which uses graphical icons and allows a user to press buttons to control the programme, and is usually more user-friendly, or a command line interface (CLI), which requires a knowledge of code, but is often faster and more powerful.
Whilst learning bioinformatics from a laboratory perspective can feel daunting to begin with, it is useful to remember that:
- Most bioinformatics (and most experts) are self-taught, and you can do the same – if in doubt, use Google!
- There are excellent (free) resources, but also experts you can check in with
- Although it's computational, it needs to be planned and recorded just as laboratory experiments are. It is advised to keep a record of all your scripts and print your terminal/console out-put for every session you run.
This guide will not teach you how to ‘do’ bioinformatics, but it will help you understand where to start, and what resources are available to help you achieve your bioinformatics goals. It is aimed primarily at people wishing to learn about sequencing bioinformatics, but the information will be of use for most people starting out with bioinformatics.
Abbreviations
|
ASCII |
American Standard Code for Information Interchange |
|
CLI |
Command line interface |
|
EBI |
European Bioinformatics Institute |
|
GIS |
Graphical imaging system |
|
GUI |
Graphical user interface |
|
HCP |
High Computing Performance |
|
Mac |
Macintosh |
|
NCBI |
National Centre for Biotechnology Information |
|
NGS |
Next generation sequencing |
|
ONT |
Oxford Nanopore Technologies |
|
OS |
Operating system |
|
VM |
Virtual machine |
|
WGS |
Whole genome sequencing |
Definitions
|
Next generation sequencing |
Next-generation sequencing (NGS), also known as high-throughput sequencing, is the catch-all term used to describe a number of different modern sequencing technologies, that differ radically from 1st generation Sanger sequencing. These technologies allow for sequencing of DNA and RNA much more quickly and cheaply, and as such revolutionised the study of genomics and molecular biology. It generally involves massively parallel sequencing of short fragments (e.g. Illumina platforms) or long reads of single nucleotide strands (e.g. ONT platforms). |
|
Whole genome sequencing |
Whole-genome sequencing (WGS) is the analysis of the entire genomic DNA sequence of an organism, providing the most comprehensive characterization of the genome. It generally involves mapping sequencing reads to a pre-existing reference genome (simpler but large rearrangements or extra genes might be missed), or de novo assembly with no prior assumptions (harder to do) |
|
Single-Cell Sequencing |
Whole-genome sequencing of the entire genomic DNA sequence of a single cell at a single time that can be picked using for example flow cytometry or microfluidic device |
|
16S rRNA profiling |
A well-established method in microbial genomics, it is widely used in microbiome research, it relies on the amplification and sequencing of the taxonomic marker gene; 16S rRNA from all bacterial members within the microbial population, |
|
Metagenomics |
Metagenomics is sequencing the entire DNA extracted directly from specimens without prior cultivation or amplification steps that may select or target specific organisms, therefore, this method gives overview on the collection of genes and genomes from various microbial members within the microbial ecosystem. |
|
Bioinformatics Pipeline |
A pipeline is composed of a wide array of software algorithms (tools) to process raw sequencing data and generate a meaningful output that can be further analysed to answer the biological question. In most cases this is a series of tools, you feed in input files, then the program takes the raw sequencing data through sequential steps, the output of one step is fed into the following one, eventually it produces output files that you can understand. |
We highly recommend that you start off with this course, as it gives an introduction to Linux and R, two useful concepts in bioinformatics:
FutureLearn – Bioinformatics for biologists
which introduces the basics of bioinformatics and computational science to biology scientists in a simple plain language. Many of the technical terms that students may encounter later in this document and elsewhere is clearly explained in this course. It runs multiple times throughout the year, so if it is not currently open, you will need to sign up for the waiting list, so that they can email you when it is open again. You can go through it at your own pace and at the end you get a certificate, it has lots of references that you should find useful too.
This presentation on "Big data: How can we develop literacy and expertise?" from Professor Neil Stoker at UCL explains why bioinformatics is so important.
Operating systems: Windows, Mac, Linux, VMs, Cloud, remote
It matters what operating systems (OS) you use, not because any is better, but because they have important differences, and bioinformaticists will often have to use a mixture.
- Microsoft Windows is the most commonly used operating system and many users will already be familiar with the layout of a Windows computer
- MacOS, run by all Apple mac computers is a version of Unix
- Linux, run by many cloud-based computers, is a different version of Unix that is open source. It can also be installed into laptops either as the main OS, or as a Virtual Machine within (for example) Windows and Mac.
- Virtual Machines (VMs) are virtual environment that work like a computer within a computer. They run on an isolated partition of the host computer with its own resources of CPU power, memory, an operating system (e.g. Windows, Linux, MacOS), and other resources. The one you are most likely to come across and need to run is Linux within your PC or laptop. This is quite easy so long as you have admin rights and enough computing capacity. In Windows, you can install WSL2 (Windows Subsystem for Linux) and in Mac you may run a Linux virtual machine through VirtualBox application
- Cloud computing is delivery of computing services over the internet, using remote servers that can be anywhere in the world. You don’t have to worry about what operating systems they are running. In most cases, you upload your input files, select the options you need for your run, then the bioinformatics analysis is run in the clouds, eventually, you get the results in interactive illustrations that you can visualize and you may be able to download some results files to your local device for further data analysis
- Remote computing is where you log into a super computers with high performance computing (HPC), so that your own computer is merely a ‘terminal’ where you input commands, and receive responses. The actual computing is carried out in the remote system (server), and the files are stored there. The difference from cloud computing is (a) that you know the location of the services, and have access to the files, and (b) you will usually access through a terminal rather than a web portal
Data formats, text editors, spreadsheets
Often the most complicated aspect of data projects is moving data into and out of and between programs. All data files are in a format, and the programs have to understand that format. There are always different versions! For example, DNA sequence can be ‘just sequence, sequence with a header line, sequence with co-ordinates, or sequence with extra text information describing e.g. where genes start and stop and what proteins they code for; it may contain 1 sequence or 1000 different sequences. You need to know what data format your program requires and what it outputs. Fortunately, these days the software is quite flexible and might say for example that it ‘accepts any well-known DNA sequence format’.
Plain text vs rich text formats: Everyone will have used word processors such as Word, but a Word file – or even text copied from a Word file – contains a lot of hidden information, including binary code, that most bioinformatics programs can’t cope with. The default text format needs to be ‘plain text, such as that produced by the simple Microsoft Notepad program’. These contain only accepted plain text characters within the ASCII (American Standard Code for Information Interchange) definition and we can usually think of it as letters, numbers, and a few special characters defining ends of lines and tabs. If you’ve ever done any programming or HTML design, you will have also used plain text for that. If in doubt, paste into a plain text editor, and then copy and paste out of it, to remove any hidden code. Although Notepad is on every PC, you might want to use a more powerful text editor such as Notepad++ (available free and can be added to any UCL PC), that has many extra features, such as colouring the text if you’re using a programming language. For Mac users, you might use Xcode which is available to download for free from Apple store.
Plain text vs binary (compressed) formats: Sometimes sequences and sequence related files are so large, that they are compressed, just as when you might have ‘zipped’ a file or a group of files. These are therefore in binary format, and programs may both be able to use these directly, and even require these. In Linux, archiving groups of files, and compressing them are separate: ‘TAR’ files are archived groups, and ‘GZIP’ files are compressed. In genome sequencing, a Sequence Alignment/Map (SAM) file is generated, but in practice you only hear about, or use, the binary version (BAM) because it is much smaller in size.
Common formats include
- FASTA (file extension.fna): this file format is used for reference genomes or reference database sequences and can have multiple sequences in a list. In this file format, each sequence read is defined in 2 lines: header + sequence code.

- FASTq= FASTA + quality scores (file extension .fastq)
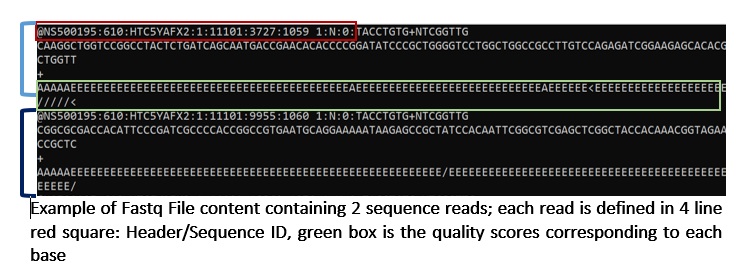
This file format is the output files of most sequencing machines and can have multiple sequences in a list. In this file format, each sequence read is defined in 4 lines: Header + sequence code + Name field (optional, usually empty line starts with "+" sign + ‘sequence quality’ information each Nucleotide base is corresponding to a code that describes its quality).
Other sequence formats
- Genbank or EMBL formats (used by sequence databases – header + sequence + extra information)
- Clustal format (multiple sequence alignment format, with gaps added where needed to make sure the similar parts of the sequences are aligned)
- SAM file (text-based format originally for storing biological sequences aligned to a reference sequence, this is usually an output file that results from an alignment step within a pipeline.
Window vs MacOS/Linux line endings
To complicate things further, even plain text differs, in that different operating systems use different ways to begin a new line:
- On PCs, they use 2 commands: the carriage return (CR) and line feed (LF) characters (think of it like an old manual typewriter, where you have to (a) push the printer carriage back to the left, and then (b) wind it on to create a new line
- On Macs and Linux (Unix) computers, there is only a line feed (LF) character. This is important because this difference – normally invisible to us – may affects how the text is handled by software
This probably won’t affect you, unless you start using Linux machines (see below) but be aware! You can convert from one format to the other in Notepad++. (In Notepad++, one ‘view’ option is to ‘show line endings’, and you will see either 1 or 2 hidden characters at the ends of lines.)
Tab-delimited/CSV files
Data in arrays – such as that you might analyse in Excel, is usually also in a used in a plain text format. Common formats are tab-delimited (a tab character between every field on a line (file extension .tab or .txt), or CSV (comma-separated value) file, where commas are used to separate fields (file extension .csv). These can both be imported into Excel (go to "Data" (tab)-> get data-> from Text/CSV; in the opened window the delimiter in most cases would be detected automatically or you should select the one compatible with your file so that the data are distributed correctly among the various columns of the spreadsheet), and can be exported from it (save as -> choose the required file extension).
Words you might encounter that relate to this (e.g. names of programs)
ASCII, Unicode, UTF-8, UTF-16, plain text editor, Notepad, Notepad++, linefeed, carriage return, tab-delimited, CSV.
Some starting links
- Microsoft help: Import or export text (.txt or .csv) files
- EMBOSS Introduction to Sequence Formats
- File formats used in bioinformatics (actually mostly sequencing formats only)
Using Command line systems
Who is this for? Anyone who will be using or linking to Linux systems, but also anyone using Mac/Windows versions of academic (as opposed to commercial) bioinformatics software, and anyone interested in programming
What is it? Most bioinformatics programmes are written by academics and have not been converted into slick software with a smart point and click graphical user interface (GUI). They also generally rely on import and export of large amounts of text (DNA sequence), take a long time to run, and people might want to repeat it multiple times, all of which are harder GUIs. They therefore utilise command line interfaces (CLIs) rather than GUIs, where you type your command into a terminal/command window. Having a basic understanding of line commands can therefore helpful, and may be essential. A command-line interface (CLI) processes commands to a computer program in the form of lines of text (Note that web versions may be available, which can be useful if used occasionally, or to try something out.)
Training and resources
Kataconda
A free useful online resource that offers interactive courses on a broad spectrum of programmes and tools: including Unix/Linux OP systems, command line basics, R software, GitHub, docker, etc. that allow learners to practice through online environment through their web browsers link.
Surrey of University - Basics of command line UNIX Tutorial
This course is recommended by EBI-EMBL as pre-requirement for their courses.
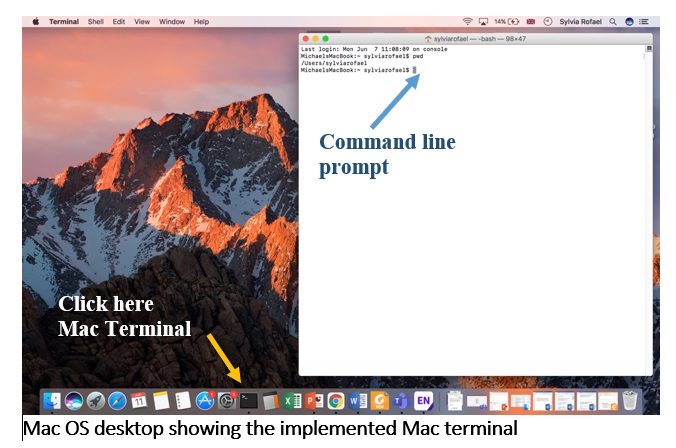
Mac terminal
Terminal is the terminal emulator included in the macOS operating system. Have a look at A beginner’s guide to using the Mac terminal.
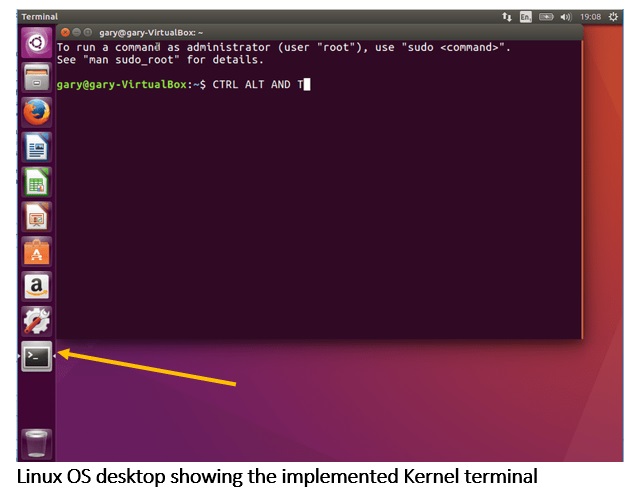
Linux command line
Beginner’s guide to the Linux command line. Ubuntu is a commonly used version of Linux, and this intro should help you understand what it is and why it’s helpful.
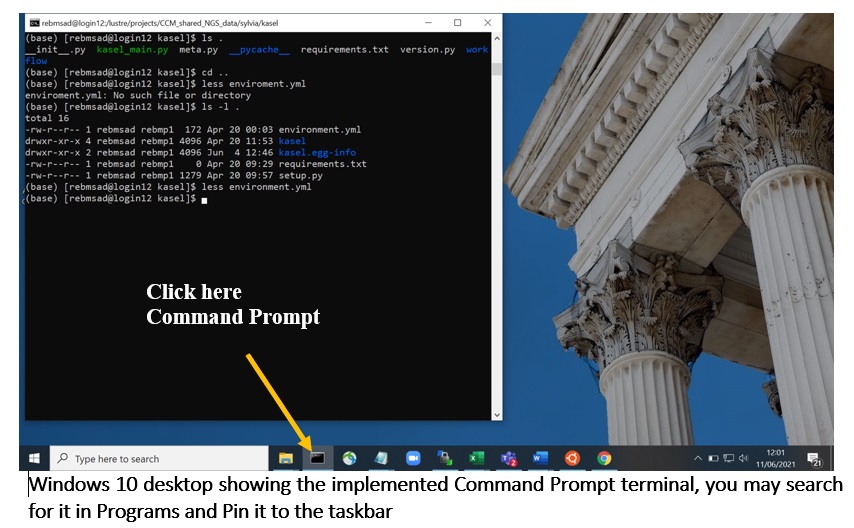
Windows command prompt
Older Windows versions had the MS-DOS prompt. Windows 10 now has the Windows Terminal, in addition to similar text-based interfaces such as PowerShell and Command Prompt or PuTTY programs. You may find this beginner’s guide to the Windows command prompt helpful.
Setting up a Windows sub-system for Linux (WSL) Ubuntu
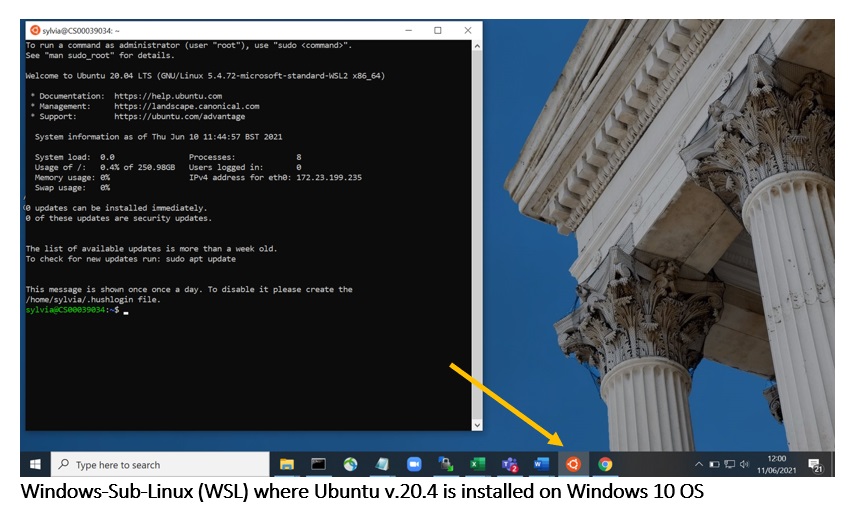
If you have a Windows computer, but want to run the Linux command line system (because a lot of bioinformatics programmes only run on Linux), you can do this by setting up a Windows Subsystem for Linux (WSL) and install a Linux distribution, such as Ubuntu, on your computer. The latest WSL version is WSL2. This link explains how to do this.
Bioinformatics programmes
Introduction to GitHub
Who is this for? Everyone should be aware that GitHub exists, and that it’s a data repository free for anyone to use, but it’s only needed if you want to download some software, or set up your own space
What is it? (in plain English) Git is an open-source version control system, and GitHub is a repository for developers who, when they create something (an app, for example), they make constant changes to the code, releasing new versions up to and after the first official (non-beta) release.
Version control systems keep track of these revisions, storing the modifications in a central repository. This allows developers to easily collaborate, download a new version of the software, make changes, and upload the newest revision. Every developer can see these new changes, download them, and contribute. Similarly, people who have nothing to do with the development of a project can still download the files and use them.
You will find that a lot of the bioinformatics programmes you may become familiar with, are stored on GitHub.
Publicly available online molecular sequence databases
Who is this for?
People who want to access all known DNA or protein sequences, to download, or look for similarity
What is it? (in plain English)
All DNA, RNA or protein sequences that are published are stored in enormous databases housed at the NCBI in the USA, or at the EBI in the UK (they synchronise with each other, so are identical). Each site has online tools for searching, downloading, and analysing these sequences. As well as sequences, they have expanded to include other molecular information such as gene expression data, protein structures, and structures of small molecules, as well as taxonomic information relating to the organisms from which the sequences derive, and academic publications.
Being able to take any sequence and see if there is anything similar in the databases is a frequently used task, and is often done using the BLAST program. All the main databases have excellent online help. Most things can be done online, though you may want to save sequences and analyse them on your home computer.
Words you might encounter that relate to this (e.g. names of programs)
BLAST, RNAseq, microarray, Clustal, Ensembl, functional genomics
Possible prerequisites: a basic understanding of genetics
Some starting links
- https://www.ebi.ac.uk/services
- https://www.ncbi.nlm.nih.gov/
- https://blast.ncbi.nlm.nih.gov/Blast.cg
- This guide from Nature explains the pros and cons of online genomic databases.
- A guide to exploring genes and genomes with Ensembl.
Training
- NCBI: Helpful training tools for navigating online databases
- EMBL self-paced learning: Our self-paced learning offering features research carried out and technologies used at EMBL. This complements our existing bioinformatics online training courses developed at EMBL-EBI. All our content is free to access anytime and anywhere
- EBI course on functional genomics: Explains the various NGS technologies and other tools for bacterial genomics
Useful Bioinformatics Tools and Programmes
N.B. All bioinformatics tools and pipelines that you may need to use, will have a manual that is very useful to read. In addition, for many of the tools and pipelines, tutorials with small data set are available for the sake of training. It is always very helpful to do these tutorials as well.
SnapGene
Who is this for? People doing gene cloning or PCR
What is it? (in plain English) SnapGene (and the free mini version, SnapGene Viewer) are great for visualising sequencing data, and are helpful for primer design and cloning
Possible prerequisites: a basic understanding of genetics, primer design etc.
Some starting links: SnapGene website (there are tutorial videos and a user guide at the bottom of the page)
Galaxy
Galaxy is an open source, web-based platform for data intensive biomedical research
GTN Smörgåsbord: A Global Galaxy Course
The program covers a general introduction to the Galaxy platform, NGS Analysis (DNA-seq and RNA-seq), Proteomics, NGS, ecology, climate science, machine learning, visualization, and many more. All the tutorials can be found on the GTN website.
Artemis
Developed by the Wellcome Sanger institute, Artemis is a free genome browser and annotation tool that allows visualisation of sequence features, next generation data and the results of analyses within the context of the sequence, and also its six-frame translation (see the further information section for the learning and support pages).
Genome Tools
The GenomeTools genome analysis system is a free collection of bioinformatics tools (in the realm of genome informatics) combined into a single binary named gt. It is based on a C library named “libgenometools” which consists of several modules.
QGIS
GIS programmes allow you to visualise geographical information by layering data over maps. QGIS is a free programme that lets you create, edit, visualise, analyse and publish geospatial information on Windows, Mac, Linux, BSD and mobile devices.
FigTree and Interactive Tree for life (iTOL)
FigTree and iTOL are useful tools to visualise phylogenetic trees and cladograms.
Statistical software programmes
You may need to use a programme more powerful than Excel to analyse data. Below are a few of the options:
SPSS
IBM® SPSS® is a statistical software which is popular within medical research community. Students at UCL can download free versions of the program to use on their personal PC and/or laptops from UCL software database. There are versions compatible with Windows or Mac. SPSS allows you to explore your data distribution, transform and visualise your data, perform statistical tests on the whole data or a subset of it, compare groups and produce publication quality figures that can be saved as picture formats. With special extensions that you can download during installation of the programme, it allows you to use python and R programming language code to perform data analysis and integrate with open source software.
Course: "Basic Statistics for Research" is a useful course in UCL Moodle in which you can self-enrol it explains the basics of statistics for medical students and shows how to do the test and read the output of SPSS.
STATA
STATA is an alternative easy to use statistical packages that runs on Windows, Mac and Unix platforms. Some free versions are available for UCL students to download from UCL software database. To learn STATA you might find these tutorials useful.
R and RStudio
R is a free software environment for statistical computing and graphics. It compiles and runs on a wide variety of UNIX platforms, Windows and MacOS. It’s a powerful programming language that can carry out statistical analyses, produce publication-quality graphics, and even produce scientific papers and theses. RStudio uses the R language to develop a more user friendly statistical programs. R may be use without RStudio, but RStudio cannot be used without R.
This course starts off with learning basic Linux commands, but also has basics of the statistical programme R, which is also really helpful. You can go through it at your own pace and it has lots of references that you should find useful too.
This R tutorial also explains the basics of R and is recommended by EMBL-EBI.
GraphPad Prism
Prism is user-friendly and has proved easy to get started with and popular with users. Although it’s not free, we have a number of licences on on-site CCM computers. For students, it costs $100 pa, with an initial 30 day free trial. It is specifically formatted for the analyses you want to run, including analysis of quantitative and categorical data. This makes it easier to enter data correctly, choose suitable analyses, and create stunning graphs. It’s quite intuitive and explains which statistical test you may want to use, based on your answers to its questions. It is also GUI-based rather than command line. You can download a free trial of Prism.
Sequencing bioinformatics
Nanopore sequencing bioinformatics
If you are going to do any Oxford Nanopore Technologies (ONT) sequencing (e.g. with the MinION), you should sign up to the ONT community website. It’s got loads of information about ONT sequencing, including the kits, protocols, papers about what people have used it for and how the mechanics of the flow cells work (also check their YouTube channel, they have some excellent videos about nanopores and how the DNA is sequenced).
Using EPI2ME Labs software
The EPI2ME Labs Launcher is used to start, stop, and update the EPI2MELabs notebook server, our interactive environment for bioinformatics exploration and learning. It provides executables for Windows 10, MacOS, and Linux. EPI2ME Labs runs within Docker. Follow the Quick Guide to install and set up Docker and EPI2ME Labs.
Example flow chart of ONT data processing
|
Process |
Data file type |
Examples of programmes to use |
|
Processing .FAST5 raw reads to .fastq files |
.FAST5 and .fastq |
Usually MinKNOW will do this for you, but can be manually done in Guppy (using Windows command line, Linux or Mac).
|
|
Quality control |
.fastq |
FastQ (single isolate) or MultiQ (multiple isolates) |
|
Alignment with reference genome |
.fastq, .fasta |
MiniMap2 |
|
De Novo assembly |
.fastq, .fasta |
Flye, Unicycler |
|
Assembly correction |
.fastq |
Medaka |
|
Variant calling |
.fastq, .bam, .vcf |
Medaka, bcftools |
|
Genome annotation |
.fastq |
Prokka |
|
Phylogenetic tree |
multiple |
Maximum likelihood: Raxml, IQ tree, FastTree Baysian: BEAST, Mr Bayes |
Online resistance gene databases
If you are looking for specific genes, e.g. resistance genes, for certain species, there are a number of online databases, to which you can upload your sequencing data, and it will identify any matches that are stored within their database.
A very useful free practical course on Coursera 'Whole genome sequencing of bacterial genomes tools and applications' has hands-on sessions and introduces the basics of bioinformatics and web-based tools offered by Technical University of Denmark for WGS of pathogens.
Pipelines specifically used for WGS of Mycobacterum tuberculosis:
- TB-Profiler: Developed by the LSTHM, TB-Profiler a pipeline which allows users to analyse M. tuberculosis whole genome sequencing data to predict lineage and drug resistance.
- MTBseq: MTBseq is an automated pipeline for mapping, variant calling and detection of resistance mediating and phylogenetic variants from Illumina whole genome sequence data of M. tuberculosis complex isolates.
- Mykrobe: Mykrobe analyses the whole genome of a bacterial sample, all within a couple of minutes, and predicts which drugs the infection is resistant to. It has been heavily validated on thousands of samples, is free, no expertise is needed to run or interpret it, and it works offline, on a standard desktop or laptop.